Table of Contents:
- Add-On Items
- Average Sale
- Monthly Statistics
- No Sale Report
- Rev Per Opportunity
- Sale/Potential/NoSale
- Sales Conversion
- Sales Statistics (Emp)
- Sales Statistics (Loc)
- Sales Vs. Opportunities
- Time With Customers
- Total Sales
Add on Items
- View Add-On Items by Percentage/Count of Transaction

- Also view by Value and Percent of Sale Amount

Average Sales
- Average sales show the average sales of each location for the time period selected.
- The graph on the right side displays the average sales per day for the entire company.

Monthly Statistics
- View Up-To-Date Monthly Statistics by Employee or Location Level
- Includes: Opportunities, Sales, No Sales, Sales Conversion, Total Sales, Average Sale, Excluded, Prospecting %, Rev per Opportunity, etc.
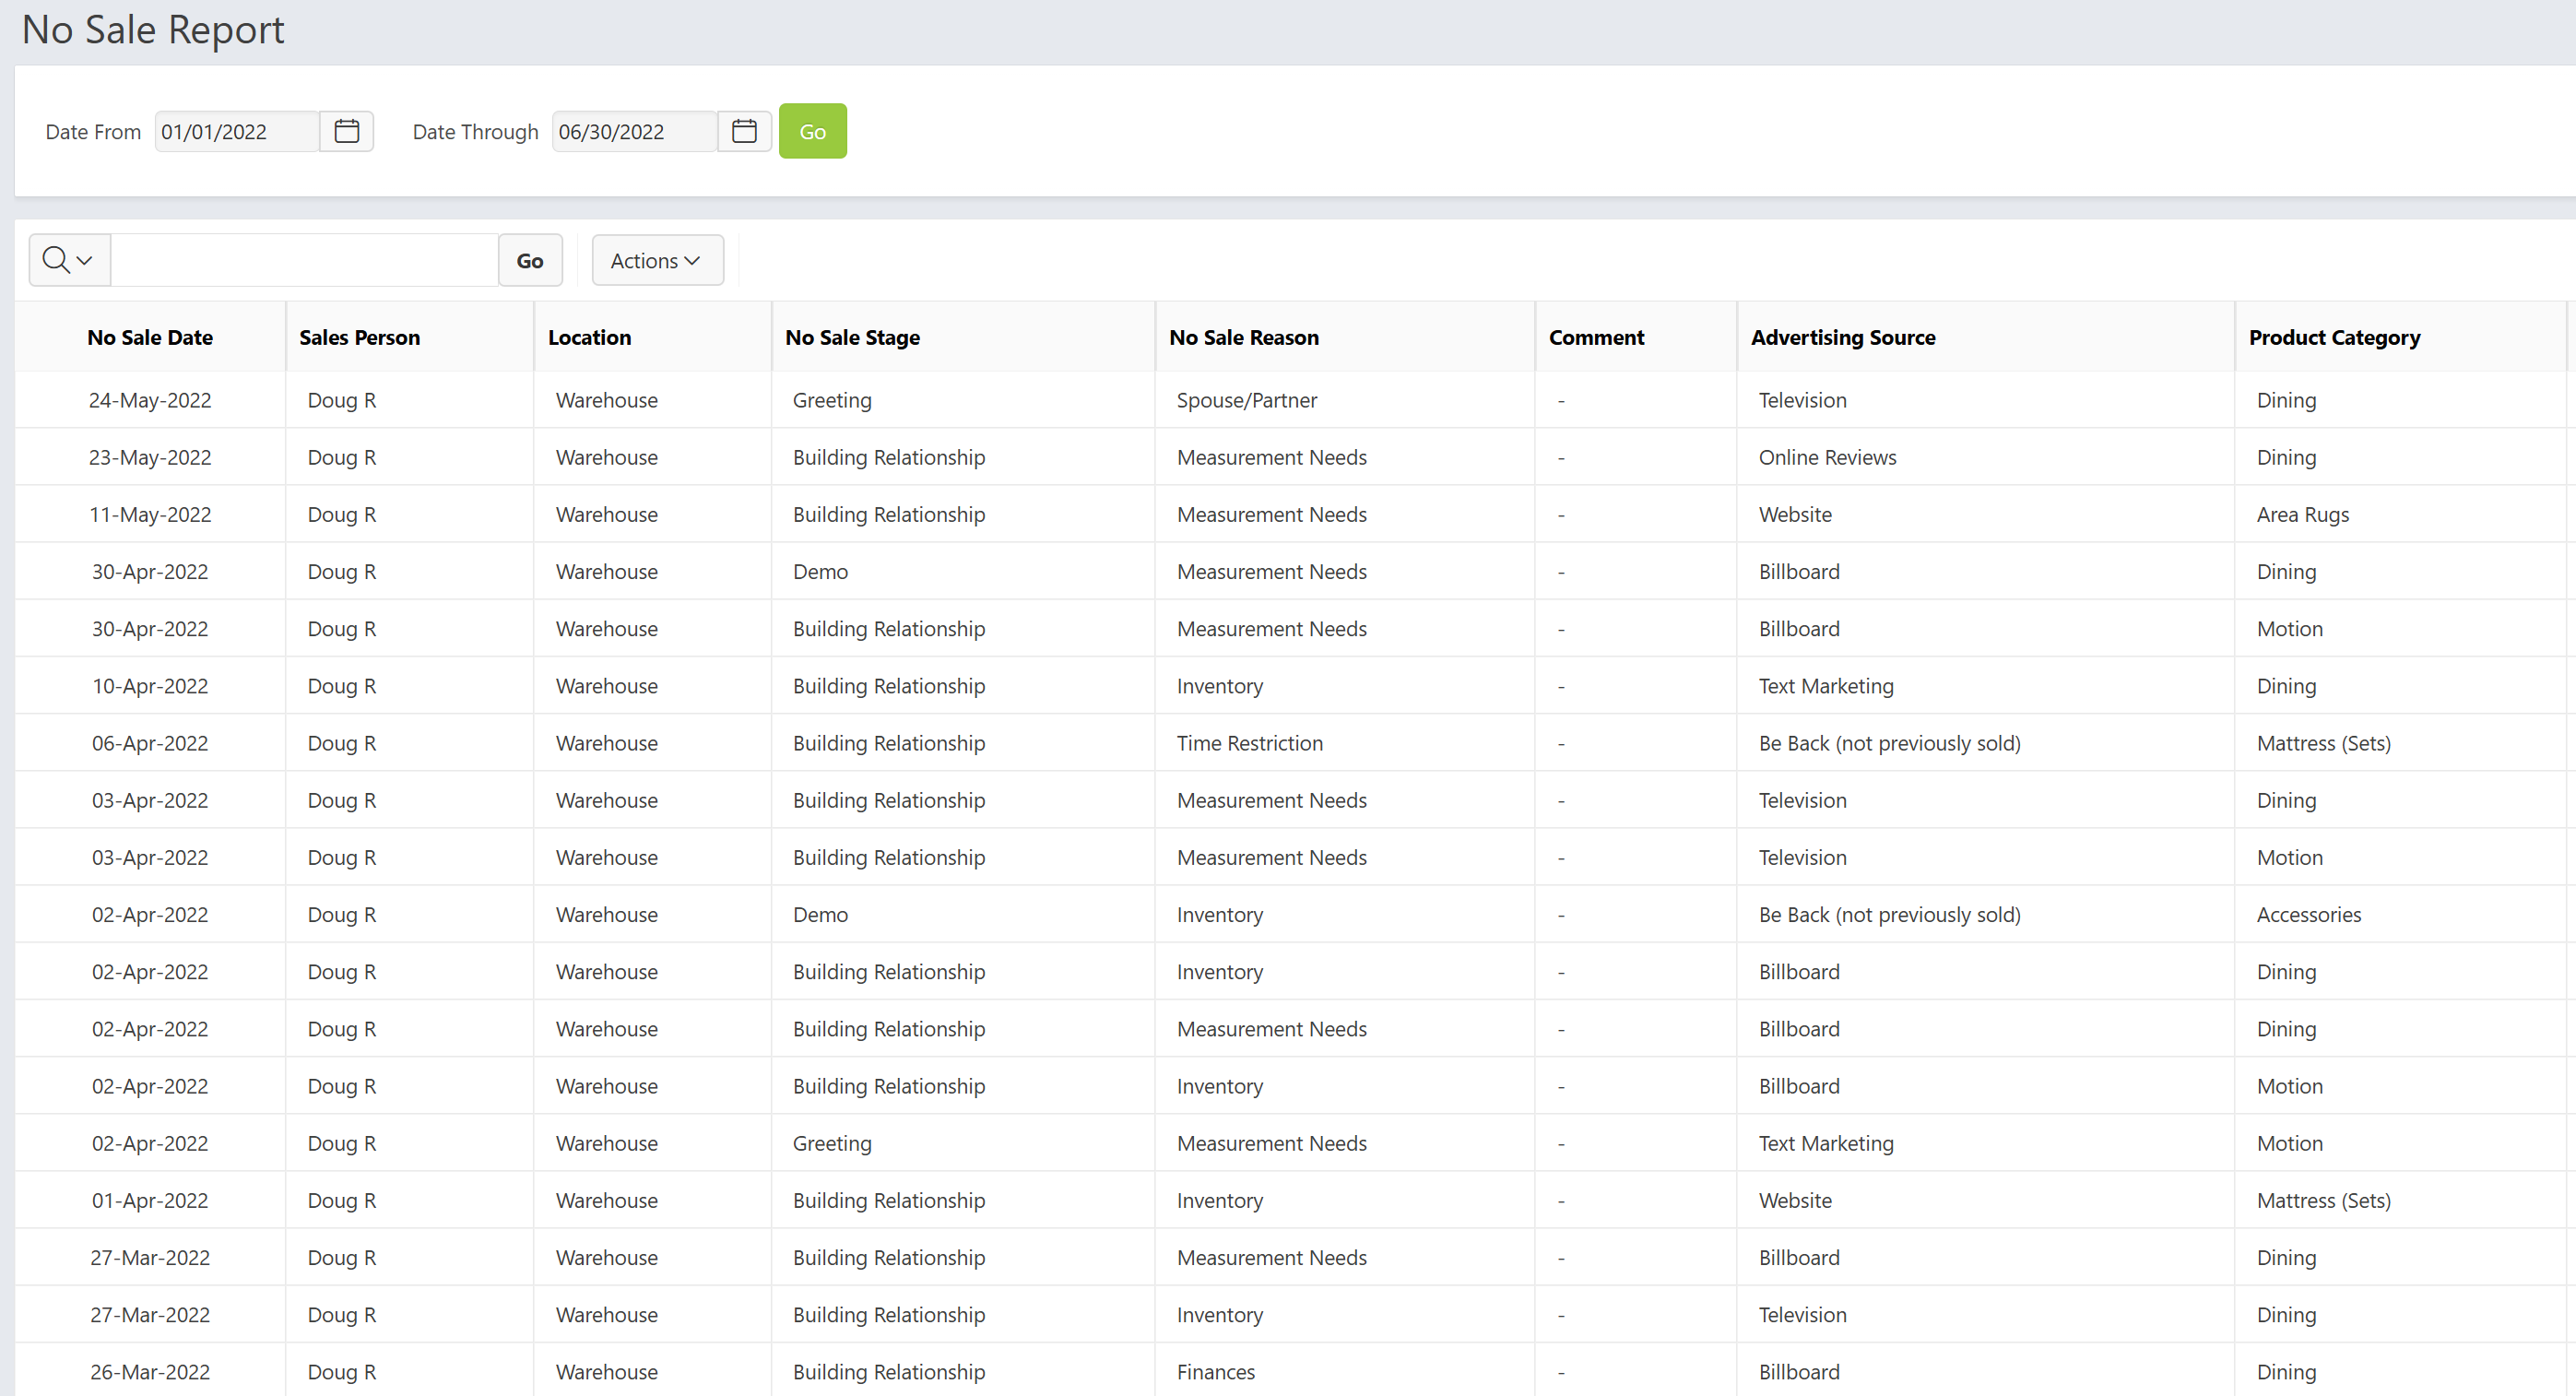
No Sale Report
- View all of the No Sales entries by a date range under one report
- Columns Include: No Sale Date, Salesperson, Location, No Sale Stage, No Sale Reason, Commetns, Advertising Source, Product Category, and any Custom options
Rev Per Opportunity
- Amount of revenue per opportunity for each store for the period selected.
- The right graph displays the revenue per opportunity for each day

Sales/Potential/No-Sale
- Shows a graph that displays the sales/potential/no-sale for each location.
- The left graph: data as a percentage, right graph: actual counts

Sales Conversion
- The left graph will show the sales conversion rate at each store
- The right graph will show the average sales conversion rate per day.

Sales Statistics (Emp)
- Shows a range of sales statistic data for each employee. (Opportunities, Sales, No Sales, Potential Sales, Sales Conversion, Rev per Opportunity, ect.)
Sales Statistics (Loc)
- Shows a range of sales statistic data for each store location.

Sales Vs. Opportunities
- Shows a bar chart for the sales vs. opportunities of the company as a whole for the time period selected. The left chart shows the store-level data in a bar graph.
- The right side shows a line graph that displays the sales vs. opportunity per day for the company as a whole.

Time with Customers
- The average time with customer per store. The buttons at the top allows you to toggle between all time with customers by Sale, No Sale, and Potential Sale.
- The left graph display a bar chart with the time with customers per store, while the right chart displays the time with customers per day.

Total Sales
- View Total Sales. The left graph: A bar chart with the total sales of the company for the period selected, right chart: the total sales per day.
