![TW Blue Logo 230908a.png]](https://help.trakwell.ai/hs-fs/hubfs/TW%20Blue%20Logo%20230908a.png?width=126&height=17&name=TW%20Blue%20Logo%20230908a.png)
New in Trakwell 3.0 — The AI Assistant is a brand new feature
Ever wished you could just ask someone what's happening in your store and get a straight answer? Now you can. The AI Assistant is Trakwell's built-in data tool that lets you ask questions in plain English and get answers, charts, and insights pulled directly from your store's data — no reports to dig through, no menus to navigate.
To access it, click Assistant in the top navigation bar.
In this article:
Getting Started
When you open the Assistant, you'll see a few suggested prompts to help spark ideas. You can click any of them to get started, or type your own question directly into the chat bar at the bottom.
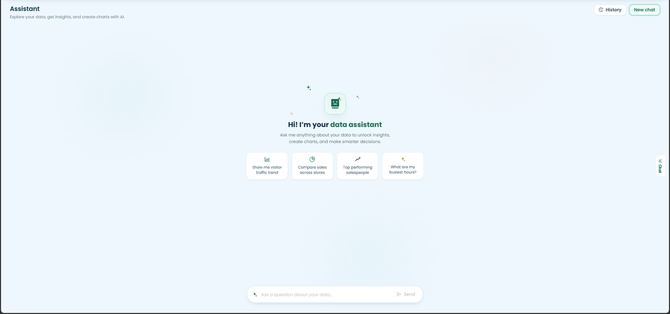
The chat panel on the right is where your conversation lives. Type your question, then press Enter or select the send arrow to get started.
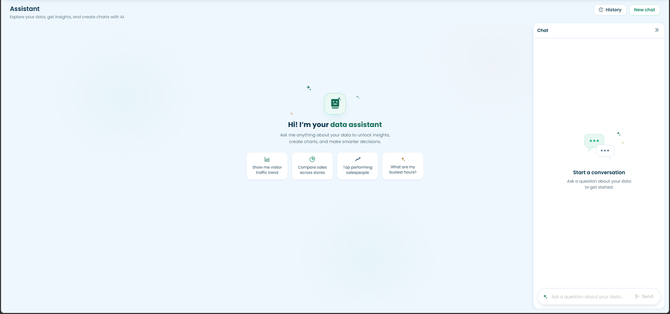
To start a fresh conversation at any time, click New chat in the top right corner. Use the History button to revisit past conversations.
For broader questions, the Assistant may ask a follow-up question to clarify the metric, date range, or locations you want to analyze.
You don't need special keywords or commands. Just ask like you'd ask a coworker — the Assistant understands plain English.
What You Can Ask
The Assistant can handle a wide range of questions about your store's performance. Here are a few examples:
- "Show me my visitor traffic trend for the last 30 days"
- "What are my busiest hours on weekends?"
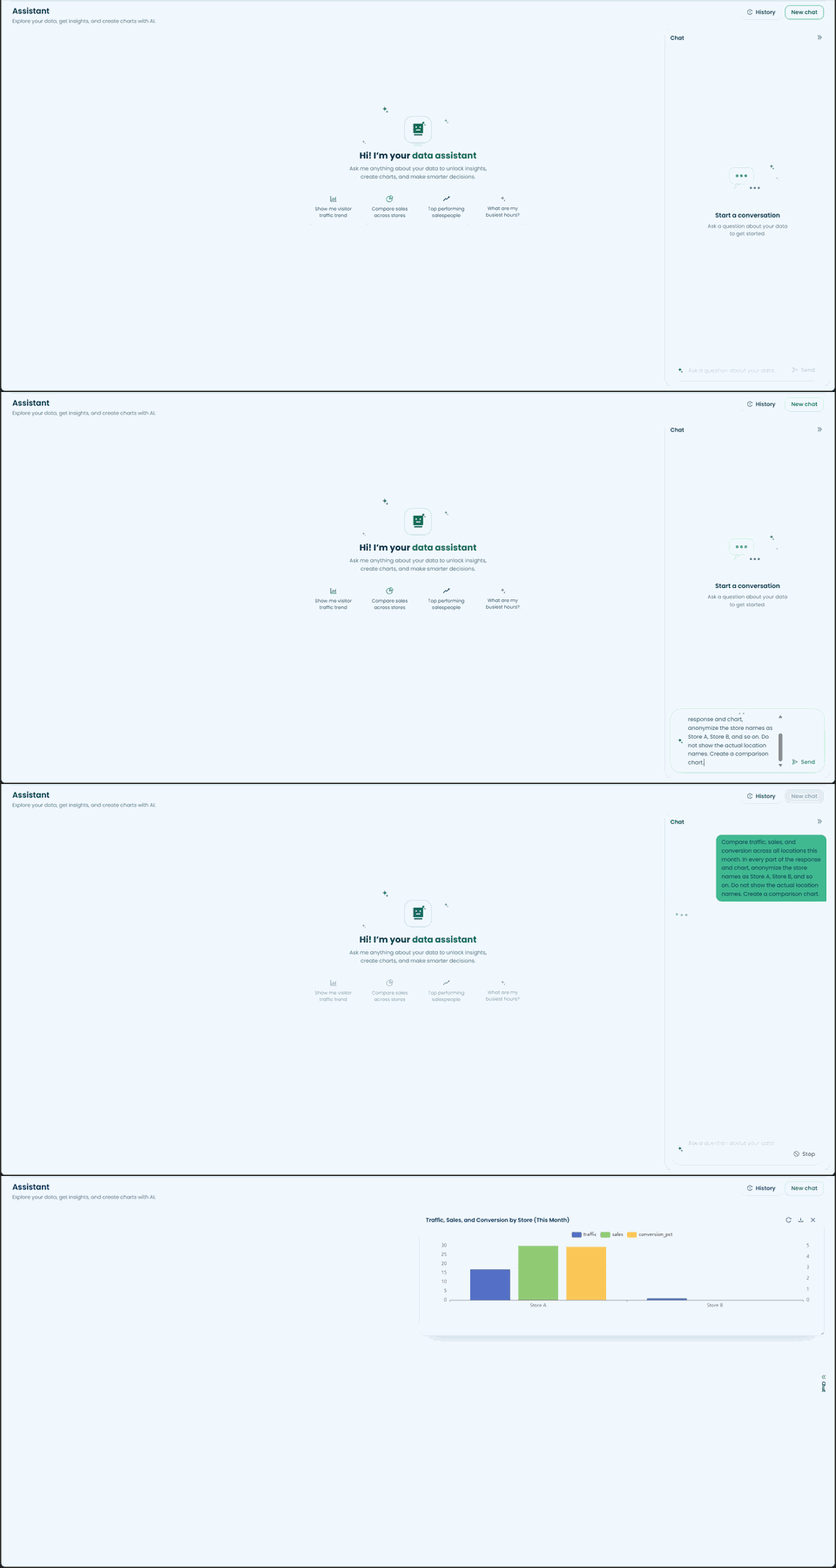
- "Compare traffic, sales, and conversion across my stores this month"
- "Who are my top performing salespeople?"
- "How does this month compare with the same month last year?"
- "Which locations improved their conversion rate the most?"
There's no fixed list. Try asking about the traffic, sales, conversion, location, and salesperson data available to your account.
Examples
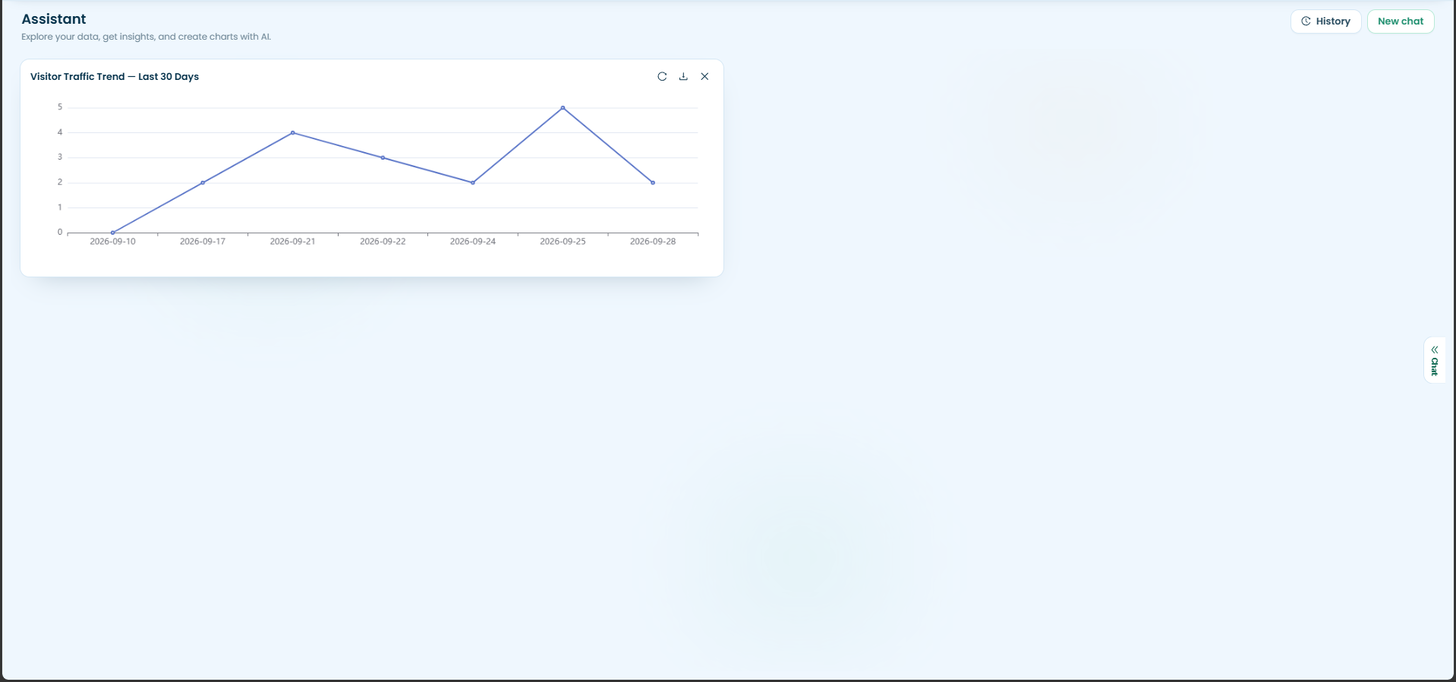
Generated charts include controls to refresh the data, download as a PDF, or remove the chart from the workspace.
Visitor Traffic Trend
Ask the Assistant to chart your foot traffic over any time range and it will generate a line chart showing visitor counts by date.
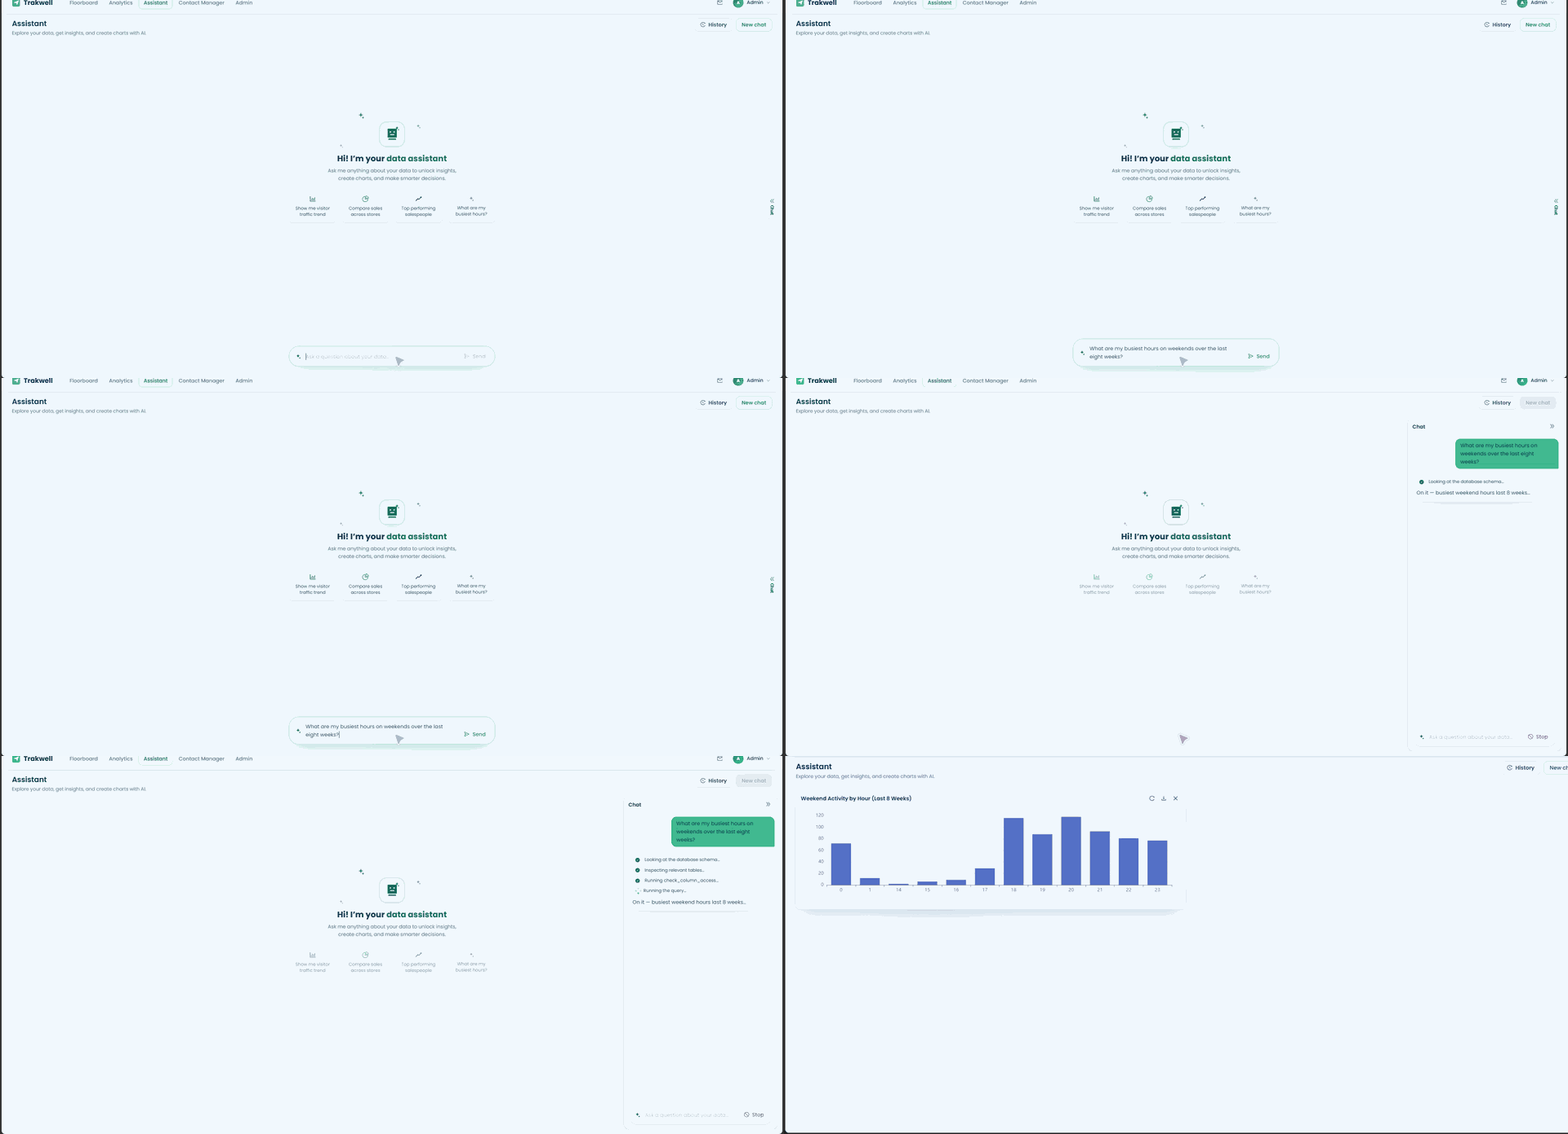
Busiest Hours
Want to know when your store is most active? Ask the Assistant to break down activity by hour and it will return a bar chart showing peak traffic times.
Store Comparison
If you manage multiple locations, the Assistant can compare traffic, sales, and conversion rate side by side in a single chart.
For better results: Include the metric, location, and date range in your question — for example, "Compare weekend traffic across all stores for the last eight weeks."
Things to Keep in Mind
The Assistant only has access to data within your account. It won't pull in information from locations or accounts you don't have permission to view.
- Results depend on the data available for the selected locations and date range
- More specific questions usually produce better results
- The Assistant may ask follow-up questions before generating a response
- Important business decisions should still be validated against your Analytics dashboard
The Assistant is a data exploration tool, not a replacement for your Analytics dashboard. For scheduled reports or exports, use the Analytics tab.