![TW Blue Logo 230908a.png]](https://help.trakwell.ai/hs-fs/hubfs/TW%20Blue%20Logo%20230908a.png?width=126&height=17&name=TW%20Blue%20Logo%20230908a.png)
The Executive View and Daily Goaling Report are the fastest way to see how things are going. The Executive View gives you a full summary of opportunities and sales, and the Daily Goaling Report shows how each store compares to last year and to your company goals.
In this article
Executive View
The Executive View is the first page you see when you open Analytics. Use it to see how many customers came in, what happened with each one, and how much you sold.
Reading the table
| Column | What it shows |
|---|---|
| Detail | The store, hierarchy level, or salesperson for that row. Click a name to drill down. |
| Assigned | Opportunities given to a salesperson that haven’t been worked yet |
| InProcess | Opportunities a salesperson is working right now |
| Unassigned | Opportunities not given to a salesperson |
| NoSale | Opportunities that didn’t buy |
| Potential | Opportunities that may come back to buy |
| Sale | Opportunities that bought |
| Total | All opportunities |
| Total Sales | Total dollar amount sold |
| Cr/Adj/Ret | Credits, adjustments, and returns (if your account uses them) |
| Adjusted Sale | Total sales after credits, adjustments, and returns |
| Avg Sale | Average dollar amount per sale |
| Close % | Percentage of opportunities that turned into sales |
The Total row at the bottom adds up everything shown.
Drilling down
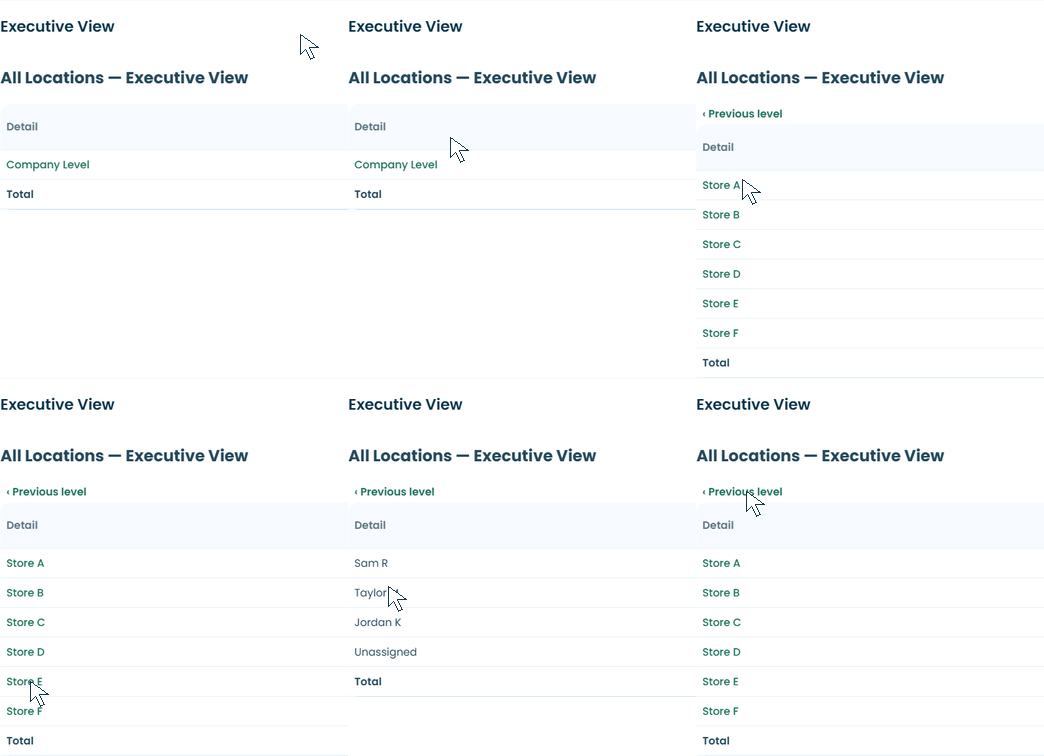
- Click your hierarchy level, like Company Level, to see each store.
- Click a store to see each salesperson.
- To go back up, click Previous level.
Charts
Below the table, three charts show the same data in a visual way:
| Chart | What it shows |
|---|---|
| All Opportunities | A pie chart of every opportunity by status: In Process, Sale, Potential, Unassigned, and so on |
| Results | A pie chart of how worked opportunities ended: Sale, Potential, or No Sale |
| Sales Vs. Opportunities | A bar chart comparing the number of opportunities to the number of sales |
💡 Tip: To print the Executive View, click Print at the bottom of the page. For more, see 👉 Printing a report.
Daily Goaling Report
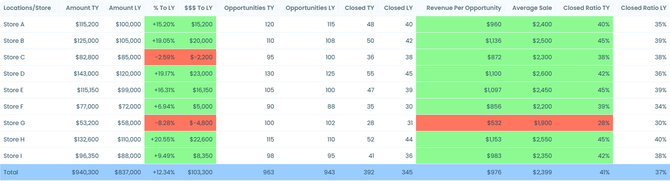
The Daily Goaling Report shows how each store is doing this year (TY) compared to last year (LY) and to your company goals. It’s a great report to check each morning or to get by email every day.
📝 Note: This report shows data by store only. It doesn’t drill down to salespeople.
Reading the table
| Column | What it shows |
|---|---|
| Locations/Store | The store for that row |
| Amount TY / Amount LY | Total sales this year and last year |
| % To LY | How this year’s sales compare to last year, as a percentage |
| $$$ To LY | The dollar difference between this year and last year |
| Opportunities TY / LY | Opportunities this year and last year |
| Closed TY / LY | Sales this year and last year |
| Revenue Per Opportunity | Total sales divided by opportunities |
| Average Sale | Total sales divided by the number of sales |
| Closed Ratio TY / LY | Percentage of opportunities that turned into sales, this year and last year |
The Total row at the bottom, highlighted in blue, adds up all stores.
What the colors mean
| Column | Green | Red |
|---|---|---|
| % To LY | Up compared to last year | Down compared to last year |
| Revenue Per Opportunity | Meeting your company goal | Below your company goal |
| Average Sale | Meeting your company goal | Below your company goal |
| Closed Ratio TY | Meeting your company goal | Below your company goal |
The other columns, including Closed Ratio LY, don’t change color.
📝 Note: Company goals are set by the company admin in the Admin tab. If your colors don’t look right, check with your company admin that the goals are set.
Using the table
The Daily Goaling Report has the full set of table tools, like searching, filtering, sorting, and downloading. See 👉 Working with tables for how to use them.
Getting it by email every day
- Click Actions > Subscription.
- Fill in the details, the same as any other subscription.
- In How many Days, enter how many days of data each email should include.
- Click Apply.
📝 Note: The Daily Goaling Report is always sent daily, so there’s no frequency option. To change or stop a subscription later, go to Admin > Subscription Management.
Still have questions? Call or text us at 833-503-9934, email support@trakwell.ai, or submit a ticket.