![TW Blue Logo 230908a.png]](https://help.trakwell.ai/hs-fs/hubfs/TW%20Blue%20Logo%20230908a.png?width=126&height=17&name=TW%20Blue%20Logo%20230908a.png)
Most reports in Analytics share the same set of tools. Once you learn them here, you can use them on any report. Not every report has every tool, so if you don’t see a button, that report just doesn’t use it.
In this article
- Changing dates
- Printing a report
- Subscribing to a report
- Working with tables
- Downloading or emailing a report
- Using charts
Changing dates
Most reports have From and To dates at the top. Pick new dates and the report updates on its own. There’s no need to click a button.
Printing a report
Click Print to create a PDF of the report you’re looking at. From there, you can print it or save it to your computer.
Subscribing to a report
A subscription emails you a report on a schedule, so you don’t have to log in to check it.
- Open the report and click Subscribe.
- Fill in the details:
| Field | What to enter |
|---|---|
| Who should get the report | |
| Subject | The email subject line |
| User report | A name for this subscription so you can find it later |
| Send even when there is no data | Check this to get the email even on days with nothing to report |
| Frequency | Daily, Weekly, or Monthly |
| Format | CSV, HTML, or Excel |
| Start Date / End Date | The dates for the subscription |
3. Click Apply.
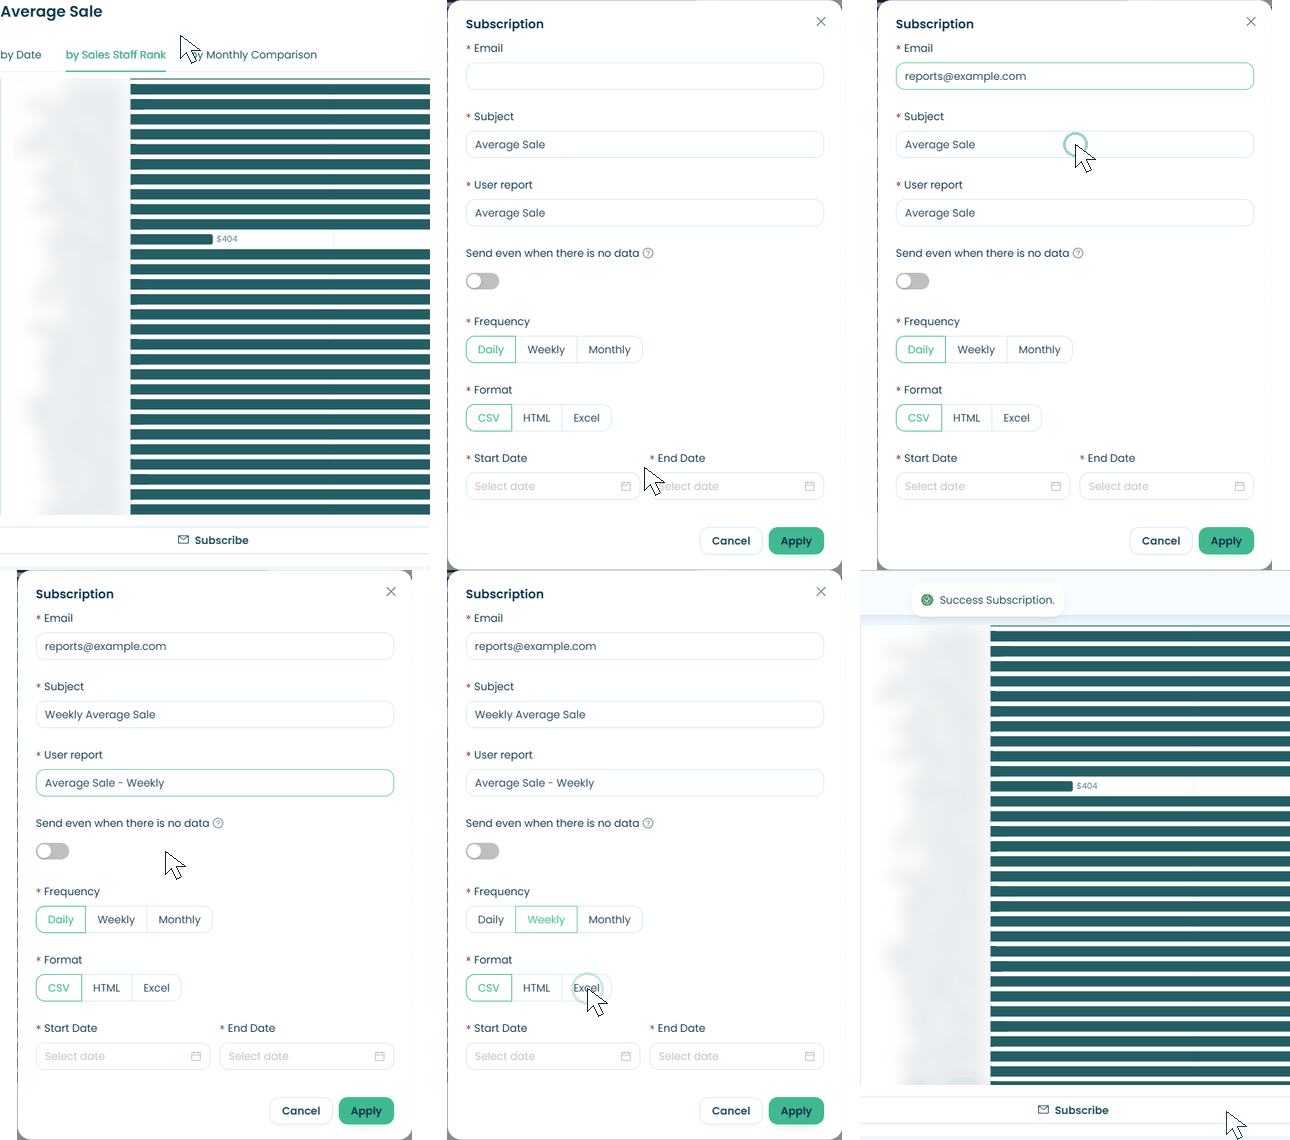
📝 Note: On table reports, Subscription is in the Actions menu instead of a Subscribe button. The Daily Goaling Report and Analytics Dashboard have a few extra subscription options, covered in their own articles.
Working with tables
Many reports show a table you can search, filter, and rearrange.
Searching
Type in the search bar above the table and click Go. To search in one column only, click the magnifying glass and pick a column, or leave it on All Columns. Your search shows up as a filter above the table. Click the X on it to remove it.
The Actions menu
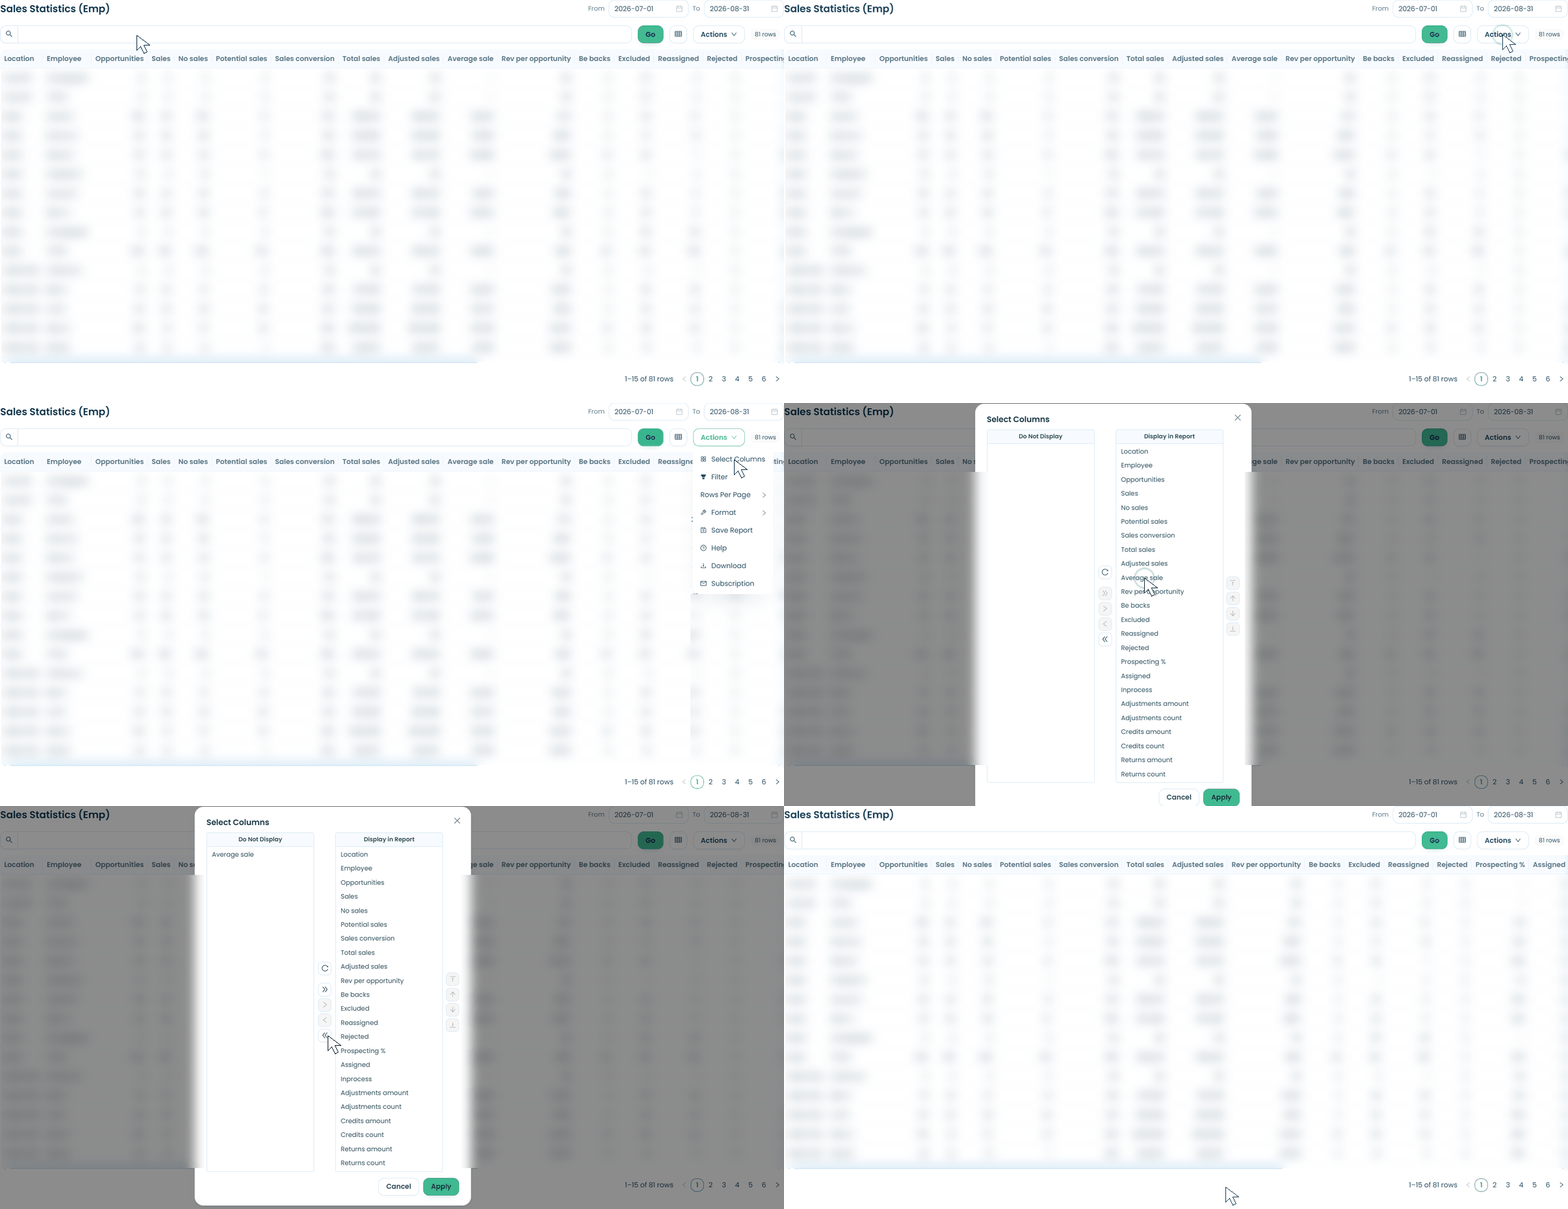
Click Actions to see more options.
| Option | What it does |
|---|---|
| Select Columns | Choose which columns show and in what order |
| Filter | Show only the rows that match what you pick |
| Rows Per Page | Change how many rows show at once |
| Format | Change how the table looks (see below) |
| Save Report | Save your layout to use again |
| Reset | Go back to the original layout |
| Help | Open help for the table tools |
| Download | Download or email the table (see below) |
| Subscription | Get the table emailed on a schedule (on some reports) |
Format options
| Option | What it does |
|---|---|
| Sort | Sort by one or more columns |
| Control Break | Split the table into sections by a column, like one section per store |
| Highlight | Color rows or cells that match a condition |
| Compute | Add a column that does a calculation |
| Aggregate | Add totals or averages to a column |
| Chart | Turn the table into a chart |
| Group By | Summarize the table by a column |
Column menus
Click any column heading for quick options: sort it, hide it, split the table by it (Control Break), or filter by one of its values.
Saving a report
If you set up a table the way you like it, save it so you don’t have to redo it.
- Click Actions > Save Report.
- Enter a Name and a Description.
- Click Save.
A yellow Saved Report label shows above the table while you’re using it. To go back to the original layout, delete the saved report or click Reset.
Moving between pages
Use the page arrows at the bottom of the table to see more rows.
Downloading or emailing a report
- Click Actions > Download.
- Pick a format: CSV, HTML, Excel, or PDF.
- To download, click Download. To email it instead, turn on Send as Email, fill in To, Cc, Bcc, Subject, and Body, then click Send.
⚠️ Caution: PDF downloads can’t be sent by email. Pick CSV, HTML, or Excel if you want to email the report.
Using charts
Drilling down
Use the Locations panel to switch between your company, a store, or a salesperson. On some charts, you can also click a bar to drill down. For more on this, see 👉 Moving between locations and salespeople.
Zooming in on a date range
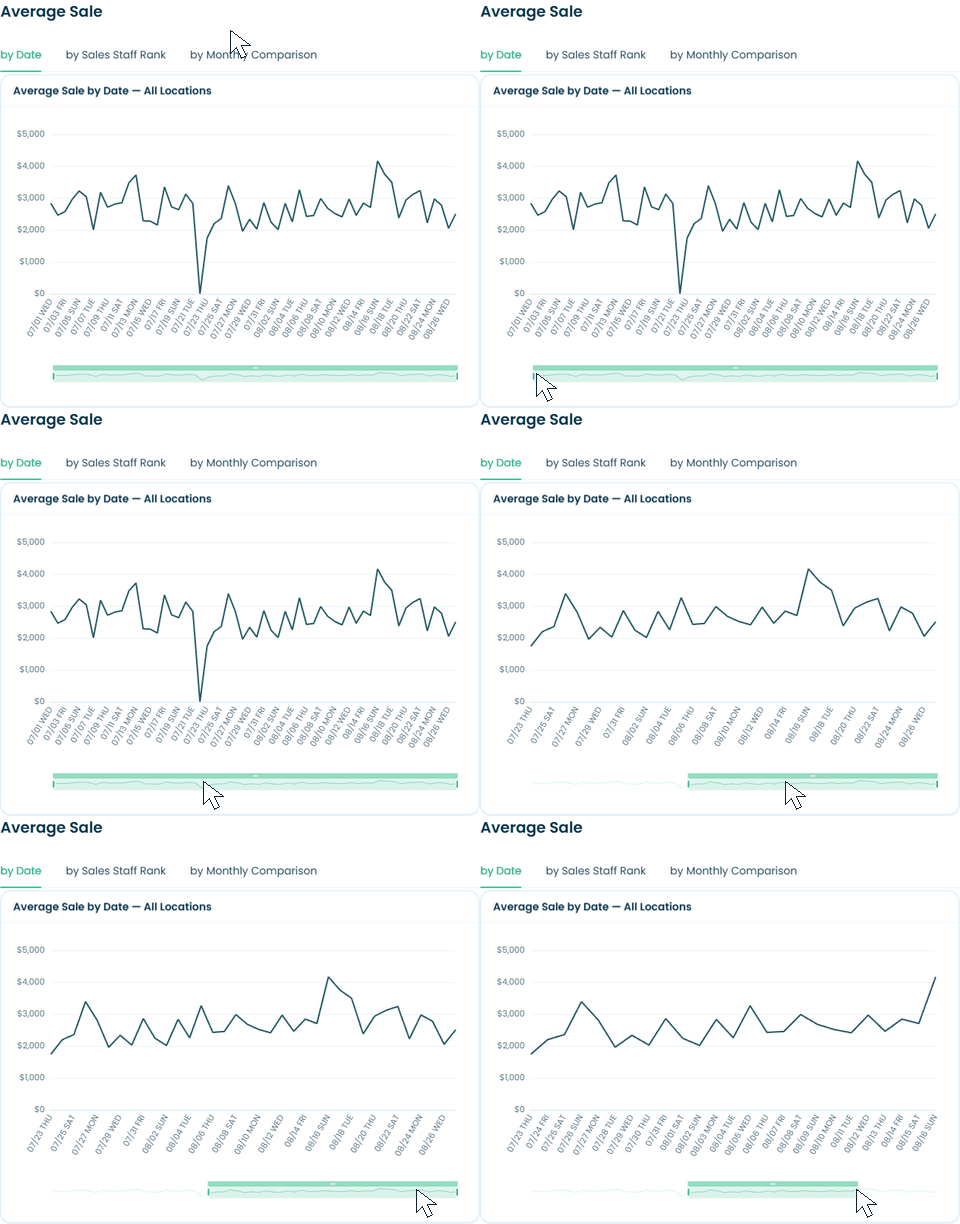
Charts that show data over time have a zoom slider below them. Drag either end of the slider to focus on a shorter period.
Switching between a chart and a table
Some charts have a Chart / Report toggle. Click Report to see the same data as a table.
Hiding lines on a chart
Click an item in the chart’s legend, like Goal or Average, to hide or show that line.
Sorting a chart
Some charts let you change the order of the bars:
- By date charts: sort alphabetically or by value
- Staff rank charts: sort by name or by rank
Monthly Comparison
Some reports have a Monthly Comparison tab that compares two years side by side.
- Pick Year 1 and Year 2.
- The bar chart shows Year 1 in blue and Year 2 in red.
- The table below shows each month, with a percentage row comparing Year 2 to Year 1.
Hover over a bar to see its exact value.
⚠️ Caution: The Monthly Comparison chart and table use the years you pick, not the From and To dates. The cards at the top still follow your From and To dates.
Still have questions? Call or text us at 833-503-9934, email support@trakwell.ai, or submit a ticket.