![TW Blue Logo 230908a.png]](https://help.trakwell.ai/hs-fs/hubfs/TW%20Blue%20Logo%20230908a.png?width=126&height=17&name=TW%20Blue%20Logo%20230908a.png)
Analytics is where you can see how your stores are doing. It shows how many customers walked in, how many turned into sales, how your salespeople are performing, and much more. If you used Trakwell before, Analytics is what used to be called Reports.
In this article
- Who can use Analytics
- Moving between locations and salespeople
- Finding your way around
- Where report options come from
- Common terms
Who can use Analytics
What you see in Analytics depends on your role.
| Role | What you can see |
|---|---|
| Salesperson | No access to Analytics |
| Store manager | Reports for their own store |
| Company manager | Reports for all stores on the account |
| Company admin | Reports for all stores on the account |
📝 Note: Company goals, like Average Sale Goal, Revenue Per Opportunity Goal, and Conversion Rate Goal %, are set by the company admin in the Admin tab. These goals show up as goal lines and colors in several reports.
Moving between locations and salespeople
Most reports let you look at your data at different levels, from your whole company down to a single salesperson.
All Locations > Hierarchy level > Store > Salesperson
The hierarchy level is named by your company, like “Company Level” or a region name. Some accounts have more than one.
Drilling down
To look at a smaller group, click a name in the Locations panel on the left side of the report. The report updates to show only that location or salesperson. On some reports, you can also click a bar on the chart to drill down.
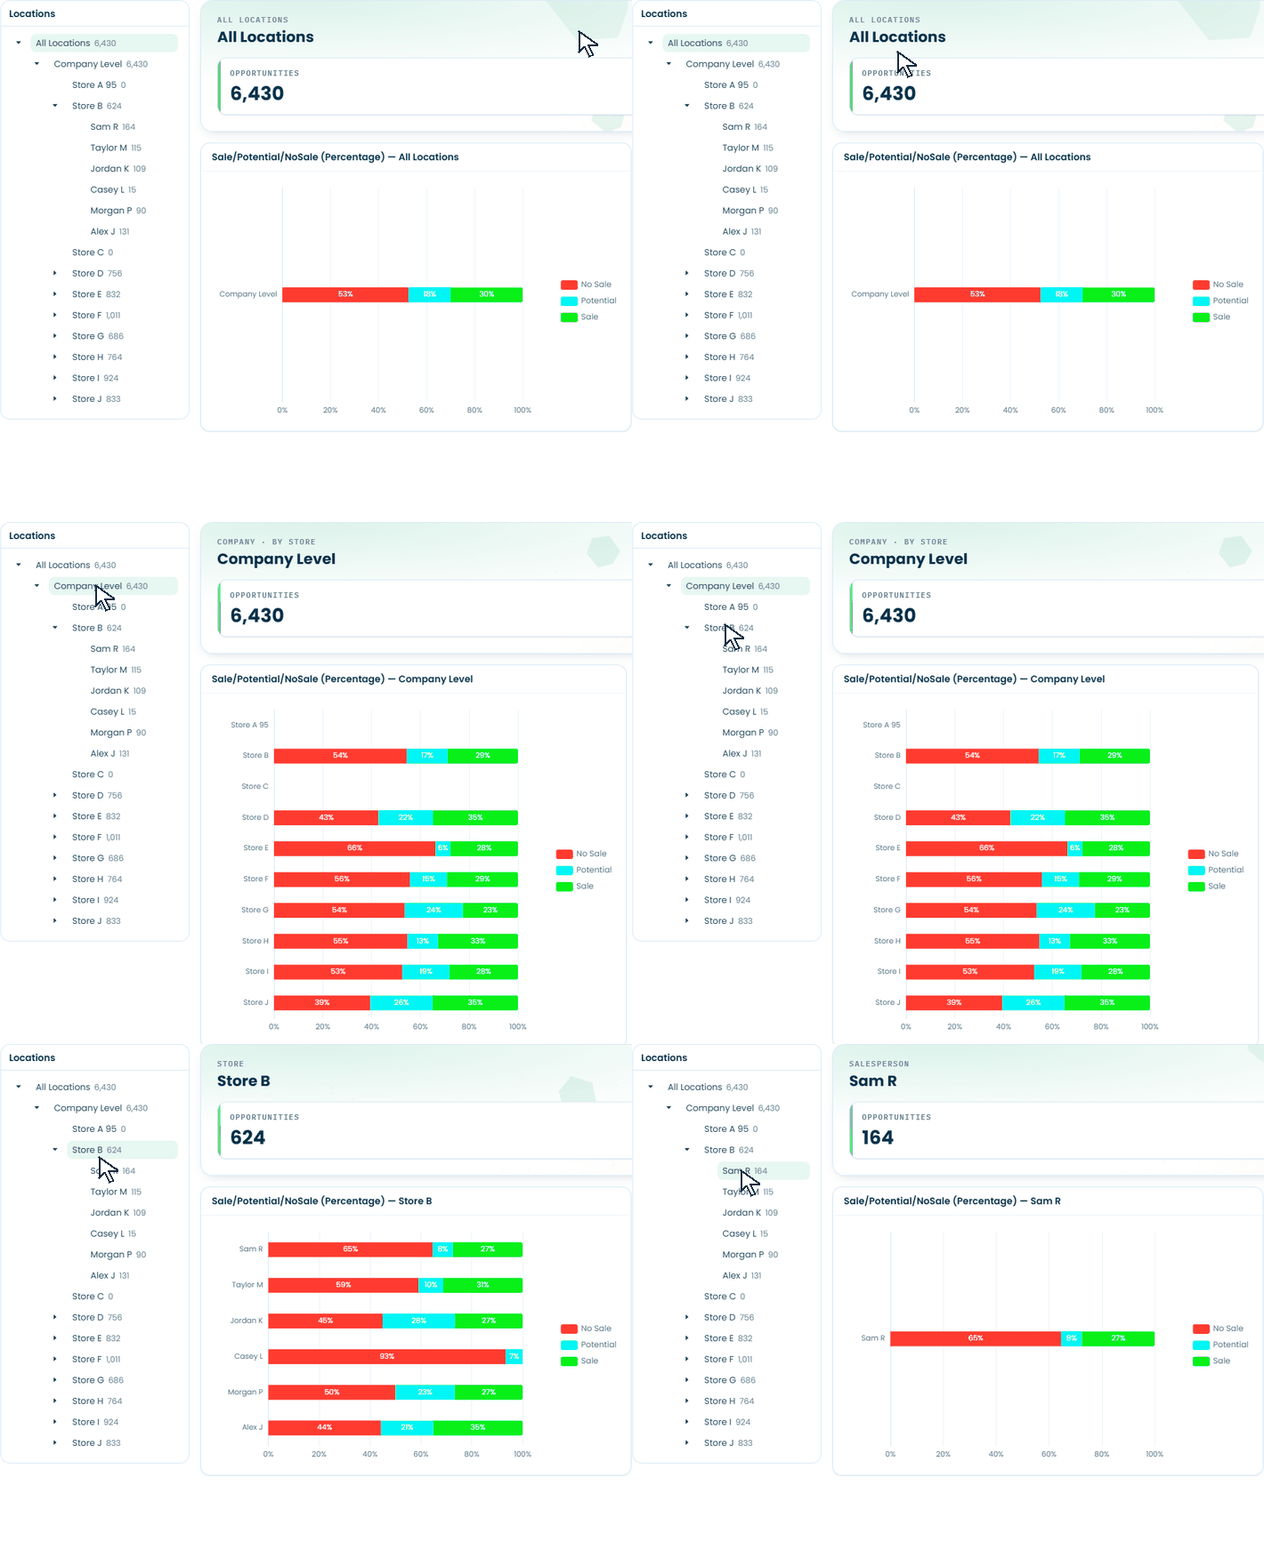
💡 Tip: The numbers next to each name in the Locations panel show the total for that location, so you can spot which store or salesperson to look at first.
Finding your way around
When you click Analytics at the top of Trakwell, the Executive View opens by default. Every report is listed in the sidebar on the left, grouped the same way as the articles below. Click any article name to open it.
| Sidebar section | What it covers | Article |
|---|---|---|
| Executive View, Daily Goaling Report | A quick snapshot of results and goals | 👉 Executive View and Daily Goaling Report |
| Traffic Performance | Walk-ins, traffic patterns, photos, and excludes | 👉 Traffic Performance |
| Sales Performance: Statistics | Sales, conversion, averages, and time with customers | 👉 Sales Performance Statistics |
| Sales Performance: Analysis | Be Backs, comments, reasons, Podium, and salesperson status | 👉 Sales Performance Analysis |
| Potential Sale Report, Sales Transactions Report | Every potential sale and every sale, in full detail | 👉 Potential Sale and Sales Transactions Reports |
| Analytics (Home, Dashboard, Conversion, Revenue per Opportunity) | A faster, all-in-one view of key numbers | 👉 Analytics Dashboard |
💡 Tip: For help with buttons like Print, Subscribe, and Download, see 👉 Using Report Tools.
Where report options come from
Many reports group your data by options your salespeople pick on the Floorboard, like how a customer heard about you or why they didn’t buy. Each company sets its own list for:
- Advertising sources
- Product categories
- No Sale reasons and No Sale stages
- Reassign reasons and reject reasons
- Exclude reasons
- Potential sale options
📝 Note: Only the company admin can add, rename, or remove these options. They’re managed in the Admin tab.
Common terms
These terms show up across many reports.
| Term | What it means |
|---|---|
| Opportunity (or Count) | One customer walk-in. Every opportunity is a chance to make a sale. |
| Sale | An opportunity that ended in a purchase. |
| Potential Sale | An opportunity that didn’t buy yet but may come back. Often includes a scheduled follow-up. |
| No Sale | An opportunity that didn’t result in a purchase. |
| Exclude | A walk-in that shouldn’t count as a customer, like an employee, a vendor, or a duplicate. Excludes are tracked separately and aren’t added to your counts. |
| User Exclude | A walk-in that someone excluded by hand. |
| Auto Exclude | A walk-in the camera couldn’t confirm as someone coming in or going out, often from people standing near the door. |
| After Hours Exclude | A walk-in recorded outside store hours. |
| Be Back | A returning customer. A Be Back can also be a Sale, Potential Sale, No Sale, or Exclude. Each store may use Be Backs a little differently. |
| Assigned | An opportunity given to a salesperson that hasn’t been worked yet. |
| In Process | An opportunity a salesperson is currently working. |
| Unassigned | An opportunity that hasn’t been given to a salesperson. |
| Rejected | A salesperson turned down an assigned opportunity, sending it back to the Floorboard. |
| Reassigned | A salesperson handed an opportunity to a specific coworker. |
| Conversion (or Close %) | The percentage of opportunities that turned into sales. |
| Average Sale | Total sales divided by the number of sales. |
| Revenue Per Opportunity (RPO) | Total sales divided by the number of opportunities. |
| Prospecting % | Of the opportunities that didn’t end in a sale, the percentage that became potential sales. |
| Adjustments, Credits, Returns | Changes to sales entered on the Floorboard. Not every account uses these. |
| Split Sale | A sale shared between two or three salespeople. |
| Pre-Split Amount | The full sale amount before it was split. |
| Time With Customers | How long salespeople spent working with customers. |
| Work Time | The total time salespeople were working on the Floorboard. |
| Waiting / Other | Work time not spent with a customer. |
| Available | A salesperson is in the rotation and ready for the next customer. |
📝 Note: Some terms, like Split Sale, Adjustments, and Podium, only apply if your account uses those features.
Still have questions? Call or text us at 833-503-9934, email support@trakwell.ai, or submit a ticket.