![TW Blue Logo 230908a.png]](https://help.trakwell.ai/hs-fs/hubfs/TW%20Blue%20Logo%20230908a.png?width=126&height=17&name=TW%20Blue%20Logo%20230908a.png)
Traffic Performance shows what’s happening at your door. Use these reports to see how many customers came in, when they came in, how they heard about you, and which walk-ins didn’t count as customers.
In this article
💡 Tip: Not sure whether you need Counts or Average Counts? Counts shows how many opportunities came in. Average Counts shows the average per day and what times your traffic happens.
Average Counts
Use Average Counts to see your average traffic per day and when your stores are busiest.
Cards
| Card | What it shows |
|---|---|
| Average / Day | Average walk-ins per day |
| Total Counts | Total walk-ins for the dates you picked |
| Active Days | Number of days with traffic |
Tabs
| Tab | What it shows |
|---|---|
| by Total Per Day | A pie chart of average traffic by location, and a bar chart of average traffic by weekday |
| by Day Per Hour | Average traffic by weekday, and average traffic by hour |
| by Door | Traffic for each door (stores with more than one door) |
| By Hour Per Day | Average traffic by hour, and average traffic by hour for each weekday |
| by Monthly Comparison | Traffic by month, compared across two years |
💡 Tip: On the by Total Per Day tab, click a slice of the pie chart to drill down to that location. On any tab, you can also use the Locations panel on the left.
To print this report, click Print at the bottom of the page.
Counts
Use Counts to see how many opportunities came in, by day or by month.
Cards
The cards at the top change depending on what you’re looking at:
| Level | Cards |
|---|---|
| All Locations | Total Door Counts, Stores, Active Days |
| Hierarchy level (like Company Level) | Total, Stores |
| Store | Total, Attributed to Staff, Salespeople |
| Salesperson | Attributed Counts, Active Days |
Tabs
| Tab | What it shows |
|---|---|
| by Daily Counts | Opportunities for each day, with a zoom slider to focus on a shorter period |
| by Monthly Comparison | Opportunities by month, compared across two years |
Pie chart
The pie chart shows how traffic is split across locations or salespeople. Click a slice to drill down. At the store level, the Unassigned slice shows walk-ins that weren’t given to a salesperson.
Seeing counts as a table
On the by Daily Counts tab, click Report in the Chart / Report toggle to see a table with Description, Date, Opportunities, and Exclusions. The table has the full set of tools, like search, filters, and download. See 👉 Working with tables.
Advertising
Use Advertising to see how your customers heard about you, based on the advertising source your salespeople pick on the Floorboard.
- Pick a tab at the top: All, Sales, Potential Sales, or No Sales.
- Use the Locations panel to pick a store or salesperson. The number next to each name shows how many opportunities it had.
- The Opportunities card shows the total, and the bar and pie charts break it down by source.
📝 Note: Advertising sources are set by your company admin in the Admin tab, so your list may look different from other accounts.
You can print or subscribe to this report. See 👉 Using Report Tools.
All Photos
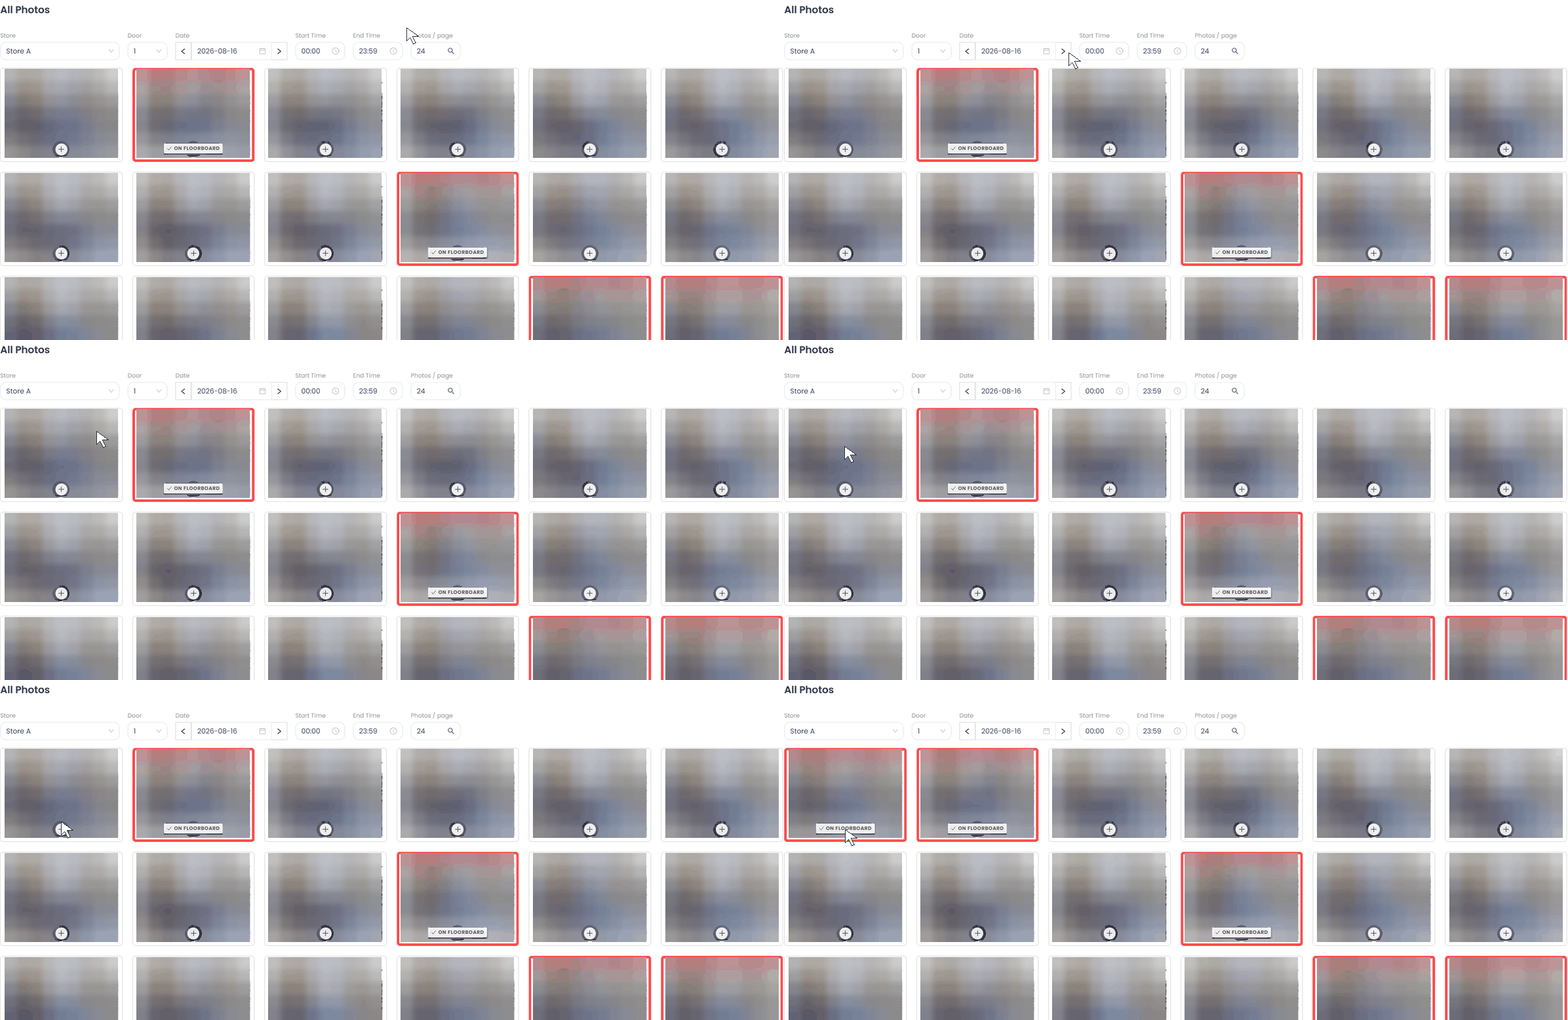
All Photos shows the pictures your door camera takes of every walk-in. Use it to look back at who came in, or to add a customer that was missed on the Floorboard.
Finding photos
Use the filters at the top to narrow down the photos:
| Filter | What it does |
|---|---|
| Store | Pick the store |
| Door | Pick the door (stores with more than one door) |
| Date | Pick the day. Use the arrows to move one day at a time. |
| Start Time / End Time | Show photos from part of the day |
| Photos / page | Change how many photos show at once |
Hover over a photo to see a preview, or click it to make it bigger.
Which photos are on the Floorboard
Photos with a red border and an On Floorboard label were posted to the Floorboard as opportunities.
Adding a missed customer to the Floorboard
If a customer walked in but didn’t make it onto the Floorboard, you can add them from their photo.
- Find the customer’s photo.
- Click the + on the photo.
The customer is added to the Floorboard as an opportunity, using the time they walked in.
📝 Note: Where the customer goes depends on the Open Floor setting on the Floorboard. With Open Floor on, they come in as unassigned. With Open Floor off, they go to the next salesperson in the rotation.
Excludes
Excludes shows walk-ins that didn’t count as customers, like employees, vendors, or duplicates. Excludes are tracked separately and aren’t added to your counts.
by Exclude Reasons
See why walk-ins were excluded. Use the Locations panel to pick a store or salesperson. The Excludes card shows the total, and the bar and pie charts break it down by reason, like Employee, Duplicate, Vendor, or Shadows / Ghosts.
📝 Note: Exclude reasons are set by your company admin in the Admin tab, so your list may look different.
You can print or subscribe to this tab. See 👉 Using Report Tools.
by Location
A table showing excludes for each store:
| Column | What it shows |
|---|---|
| Store | The store for that row |
| Total Include | Walk-ins that counted as customers |
| User Exclude | Walk-ins someone excluded by hand |
| Auto Exclude | Walk-ins the camera couldn’t confirm as someone coming in or going out, often from people standing near the door |
| After Hours Exclude | Walk-ins outside store hours |
| Total Exclude | All excluded walk-ins |
| Total Count | Everything the camera counted, included and excluded |
by Salesperson
A table showing how many walk-ins each salesperson excluded, with their login and store.
Both tables have the full set of tools, like search, filters, and download. See 👉 Working with tables.
Still have questions? Call or text us at 833-503-9934, email support@trakwell.ai, or submit a ticket.